
Excel could come in handy if you are looking to do what-if analysis, using random numbers to forecast and predict scenarios such as how your product sales change with the growth of your customer base, or how your business behaves in different economic situation.
In this article, we will learn about creating mainly 2 types of random numbers in Excel to help us create handy what-if analysis.
- Uniformly distributed random numbers
- Normally distributed random numbers
Sample Workbook
If you want to follow through examples we shown in this article, please feel free to download a copy of the workbook we use from here:
Uniformly Distributed Numbers
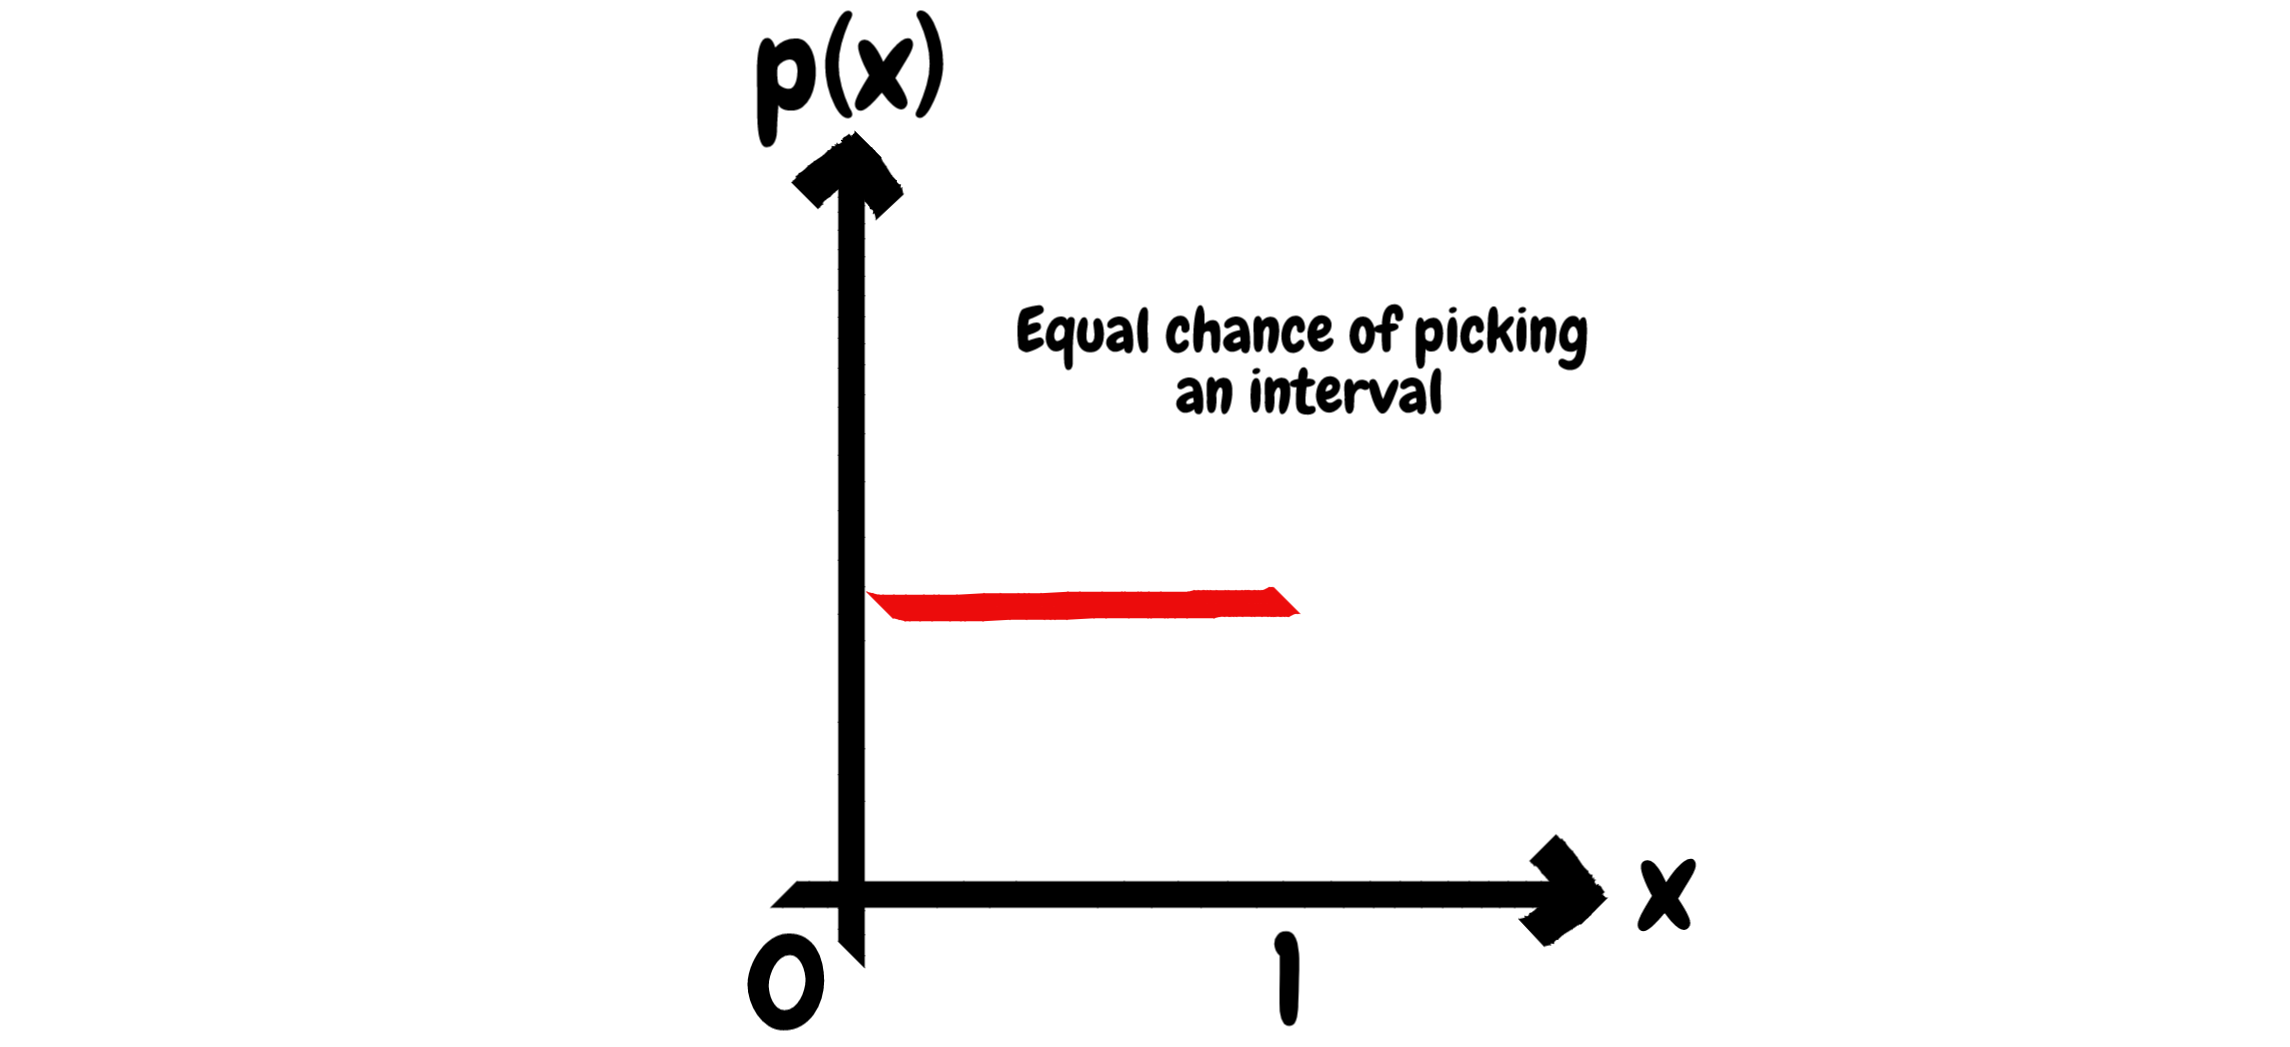
Uniformly distributed numbers means there is an equal chance for each subintervals in your range
If you play around with Excel, you’ll notice an interesting Excel function called RAND(). The RAND() function always give you a random number between 0 and 1, and aside from using it as an Excel coin toss, many practitioners actually use it for cool stuff like scenario analysis and simulations.
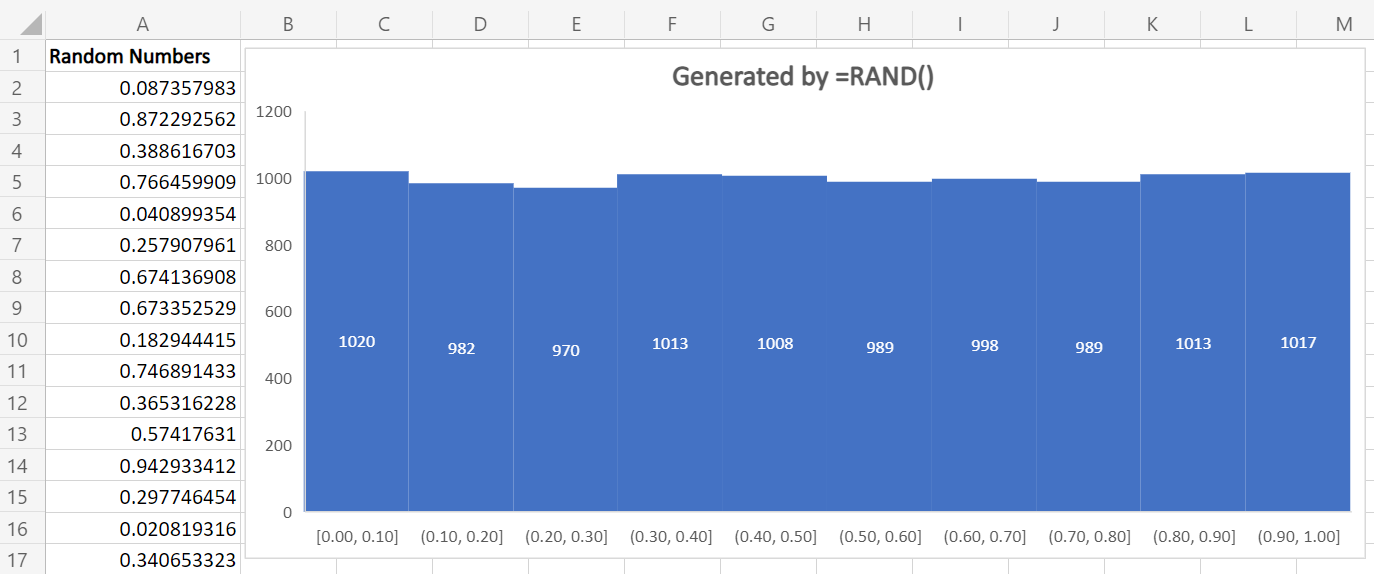
The RAND() function is actually nothing but a generator for a continuous uniform random numbers, or U(0,1) in statistical terms. This means that if you do =RAND() in a large number of cells and plot a histogram on the result, you’ll see a “flat” histogram- every interval has more or less the same occurrence.
For example, in the histogram above, we divide the 10,000 generated random numbers (using =RAND()) into 10 equal intervals, i.e. the first interval runs from 0 to 0.1, second one from 0.1 to 0.2, and so on. What you’ll notice is that each of these interval has around 1,000 generated random number falling into that particular bucket, and that’s because there is roughly 10% chance a generated random number is in any of the 10 buckets, and 10,000*10% = 1,000.
Let’s pause here and think about how can we utilize the uniformly generated random numbers. If you need to estimate the number of people visiting a store over multiple days, a naïve way to do it might be to use the observed maxima and minima of the number of people visiting the store in the past, and say that the number of people visiting the store on any day is uniformly distributed with boundaries of the observed extremes. This enables us to model the mean and standard deviation for the number of visitors to the store.
Normally Distributed Numbers
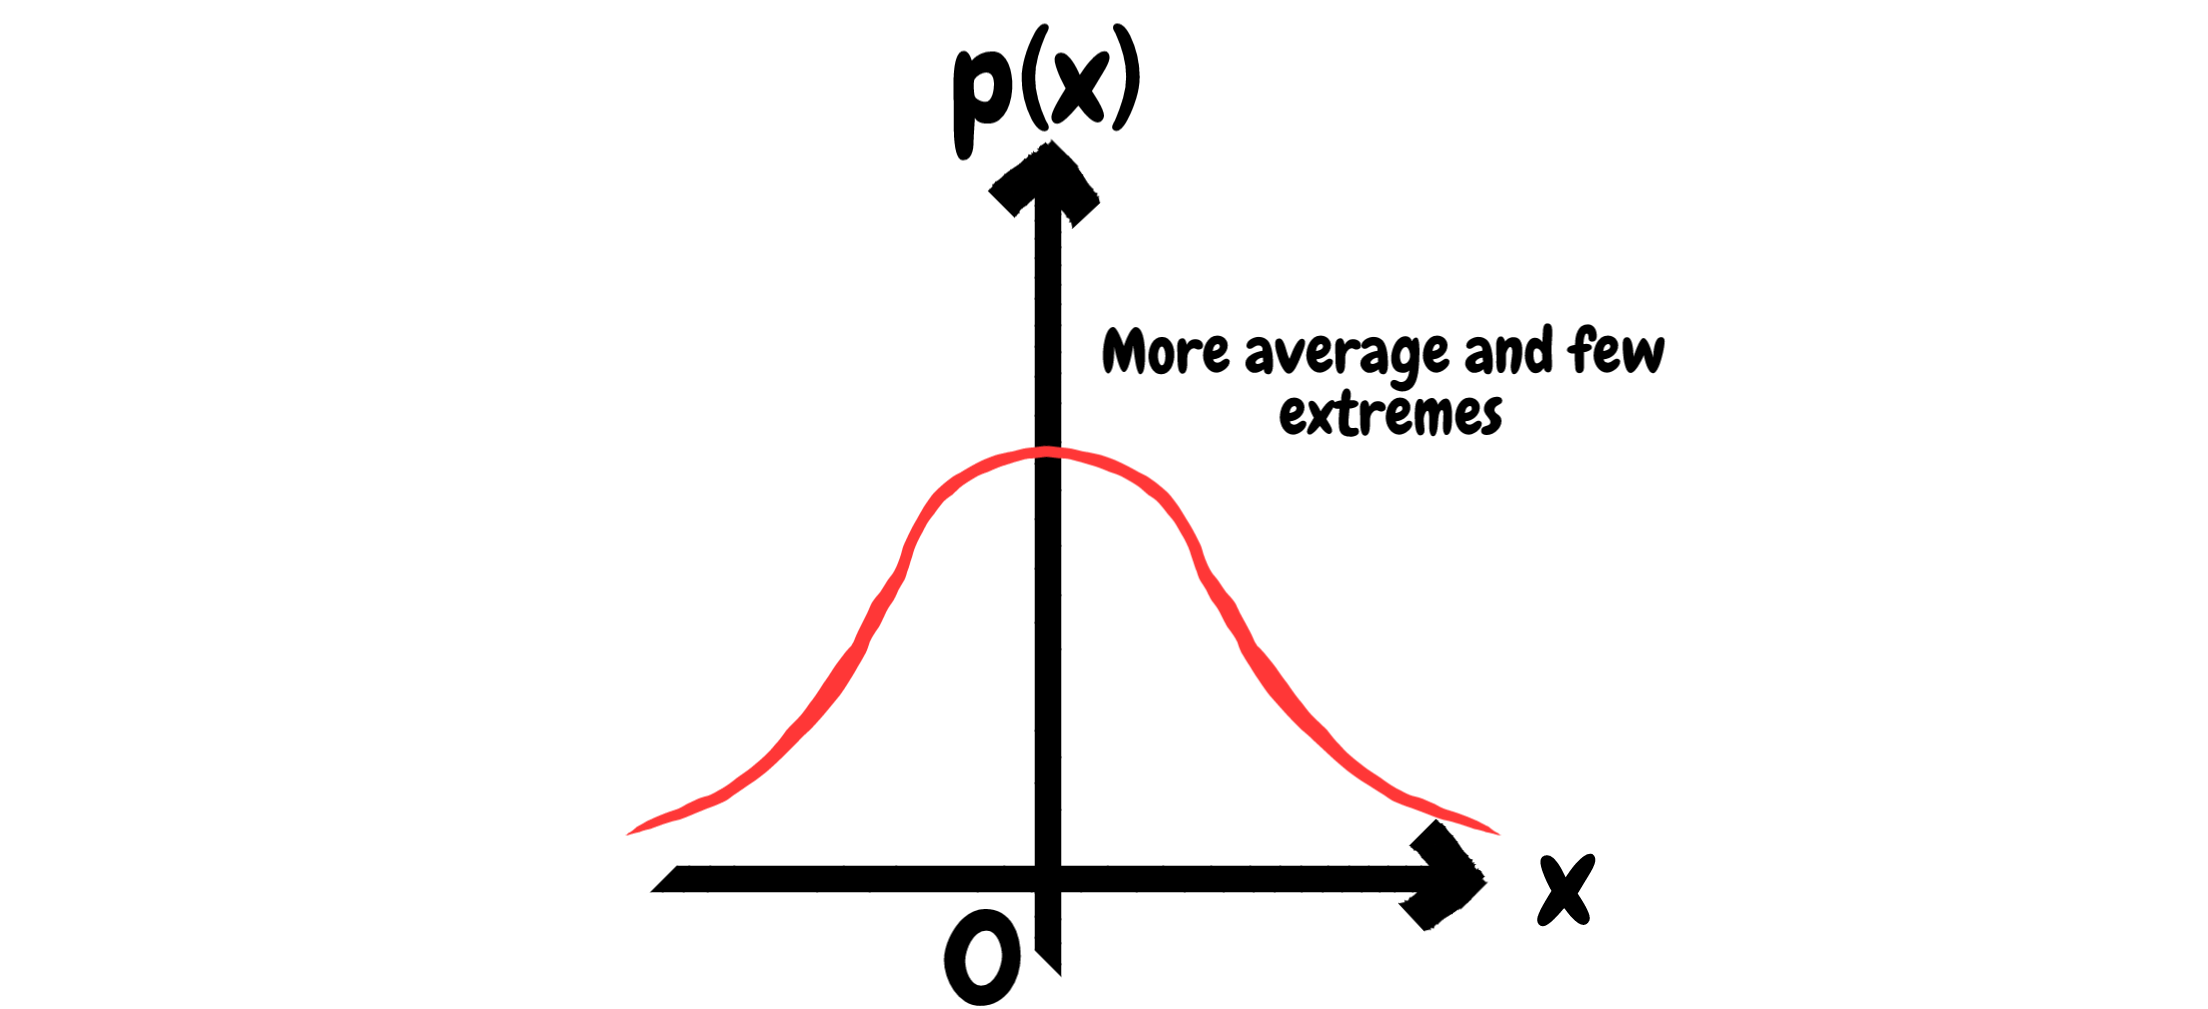
Normal Distribution accounts for the rule that "Most of the cases are average, few are extremes".
If you think that uniform distribution seems too naïve, we’re on the same boat! In reality, boundary cases (i.e. on the extremes) are very infrequent as compared to normal cases, and that is basically a defining feature for the famous Normal Distribution!
The normal distribution gain popularity, partly because it is a very useful and seen-everywhere type of statistical distribution, For example, if you look at the test scores across a large group of student – Normal distribution; IQ scores for a large group of people – Normal distribution. Normal distribution is not too bad if you want to make a start in analyzing something.
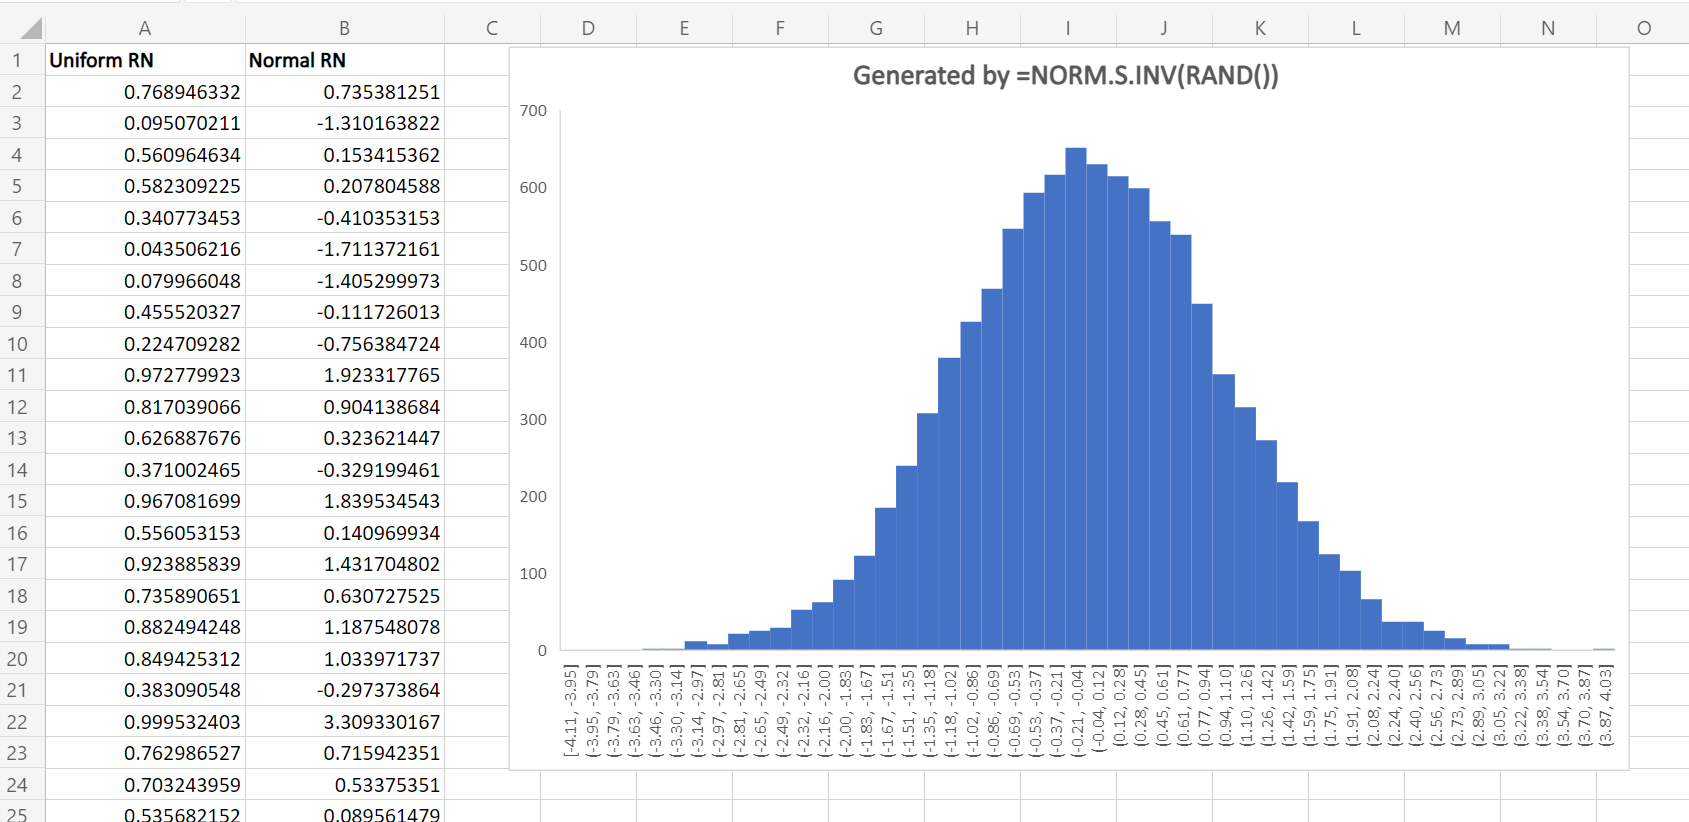
An interesting point is that practically, we’ll need to first generate some uniformly distributed numbers in order to generated a set of normally distributed numbers. You can think of the uniform distribution as the “Mother of Distributions“, where most of other distributions could be generated by having a set of uniformly distributed numbers.
Excel does the trick with the function =NORM.S.INV(), which basically gives you the value of normally distributed variable (with mean 0 and standard deviation 1) by providing it the probability. If we do =NORM.S.INV(RAND()) for a large number of cells and plot it, you’ll see that the histogram from these cells would have the normal shape!
There is a lot of applications to the generated Normal random numbers. For example, you can use it as a modelling for the scores of your students, it will give you the number of students that should get an A, B, C… through defining a specific percent for it. Another important application is to use normally distributed numbers as an input to pricing option, which is the famous Black-Scholes Option Pricing Model.
Bottom line
Through using the Excel =RAND() functions, we can create many interesting analysis through generating uniform random numbers, normal random numbers and many more. In essence, we want to help planning/understanding a particular business situation with these random numbers, and Excel is a great tool to start with!
Appendix
If you want to learn more about generating random numbers or their statistical properties, don’t forget to check out the following links: (constantly updating!)