What is IRR
Internal Rate of Return (IRR) is a very important concept in finance and accounting. When we work on investment projects that span multiple periods (e.g. You give me $10 today and I pay you $1 every year for 11 years), we often want to quantify the return of our investments. There are numerous ways to do just that (check out our article on NPV), but the IRR stands out as a way to express a “fair” rate of return earned by the cash flows from the investment. Note that IRR is a special case of a discount rate, where a discount rate is any rates that express the relationship between the value of tomorrow’s money in today’s terms.
IRR is a representation of the "fair" rate of return earned from investing in the cash flows of a project.
IRR comes in many names, for example Yield-to-Maturity (YTM) in the context of bond investment, holding period return (HPR) in the context of portfolio investment etc, but the key idea is the same – a measure of how much we earn for every $1 of our investments.
Sample Workbook
In this article, we are going to start with a familiar example with the stock price and move on to using Excel for computations. Feel free to also download the raw data from the tab below and follow through with the examples!

An example with Coca Cola
Let’s take a 1-year investment in Coca Cola stock (NYSE:KO), which is paying dividend every quarter as an example. We downloaded the stock price and dividend history from Yahoo Finance, which you can also replicate the example with other stocks.
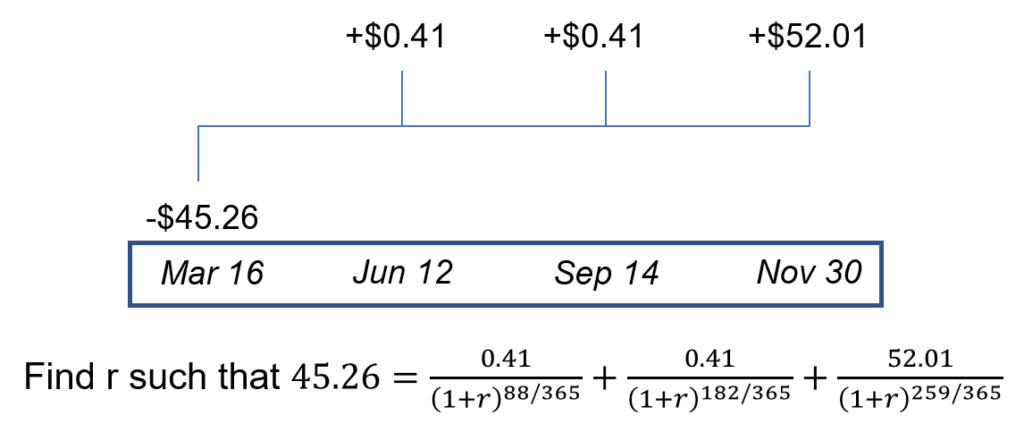
Suppose we brought Coca Cola at Apr 1, 2020 market close and proceed to hold the stock until Nov 30, 2020. As shown below, we want to find a discount rate (r) such that it measures the fair return of the investment, i.e. the return that gives you $0.41 dividend a quarter and then return you $52.01 (including Dividend) by the end of your investment. If you go ahead to solve the equation (such as by trial-and-error), you will find that the annual rate of 24.56% will satisfy that relationship below. That means, by making the investment below, you’ll earn 24.56% on an annual basis.
Let’s look at how we can come up with the IRR in Excel.
(Basic) Evenly spaced cash flows in Excel
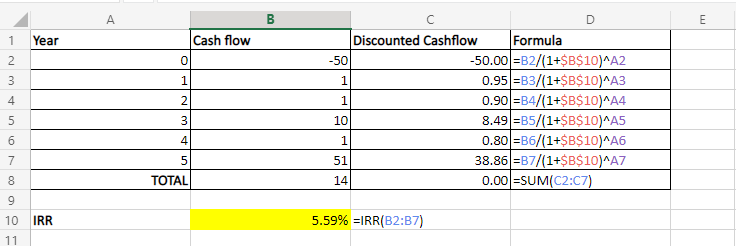
In Excel, the function =IRR() is a handy formula, Using the example in our Excel workbook above, the IRR formula in cell B10 computes the IRR for this series of cashflow in B2:B7 as 5.59%. When we verify the results in column C by calculating the discounted cash flow, we also see C2:C7 sums to 0, i.e. 5.59% is the IRR.
Two major drawbacks for this method is listed below, which we could solve in the next 2 sections:
- It only allows for the computation on cash flows that is evenly-spaced (e.g. receiving $1 every year). In our Coca Cola case, it could only approximate the IRR as the cash flows are NOT evenly spaced
- It fails to handle cases with multiple IRR
(Medium) Non-evenly spaced cash flows in Excel
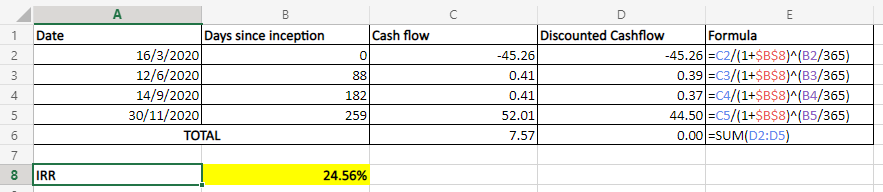
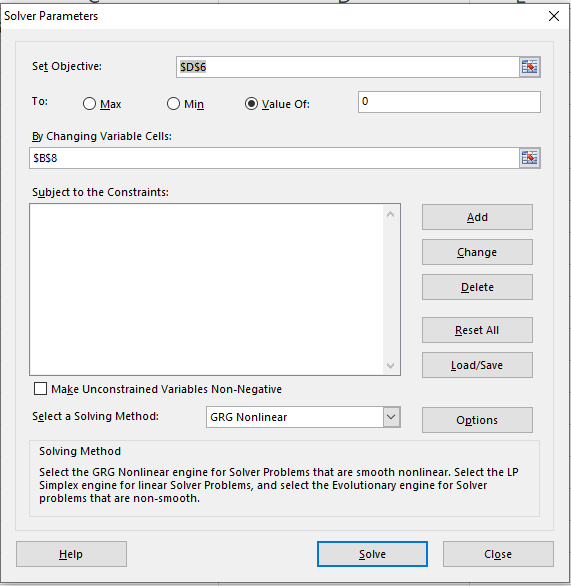
As we see in the above example, Excel =IRR() could only compute cash flows with evenly-spaced periods. To compute the IRR for non-evenly spaced cash flows, we can use the Solver add-in (check out this post if you are not sure how to use Solver). Using the below setting, Solver is able to arrive at the solution that IRR = 24.56%, which is not possible if you only use the =IRR() formula.
However, there is still a limitation to the Solver method, as it ignores the possibility of multiple IRR. Let’s discuss this in detail in the next section.
(Advanced) Multiple IRR in Excel
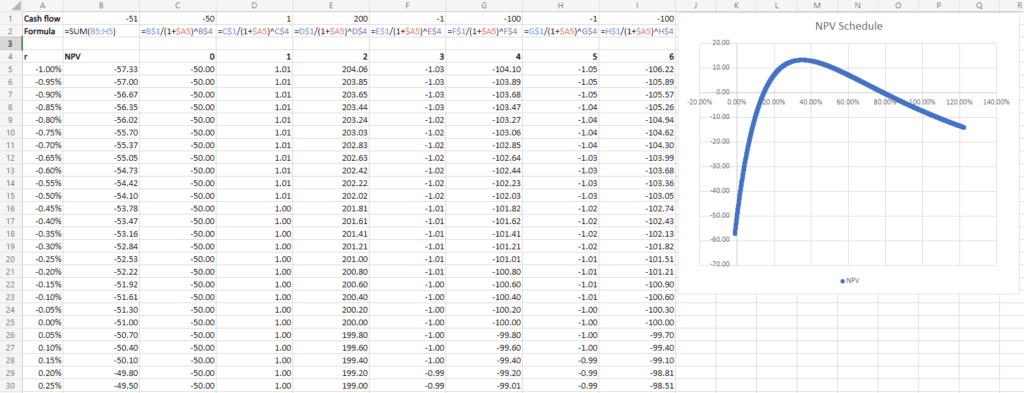
Notice how in the previous examples, only the first cash flow is negative, but all subsequent cash flows are positive? In practice, investment projects could have negative cash flow in the subsequent periods as well! This creates a problem for IRR computation because intrinsically, IRR is trying to find a solution to a multinomial equation. If you have some negative cash flows in the subsequent period, chances are, you’ll find more than 1 solution for the IRR! Sometimes it is obvious which value is the IRR, for example, 1 solution is positive and the other is negative, but in these cases plotting is actually a good way to determine a suitable IRR to use!
In the example below, we plot the NPV (sum of discounted cash flows) against the discount rate r, the rate we used for discounting the cash flows. From the graph, you can see 2 instances where the NPV=0, or equivalent, the r satisfies the equation of IRR: 14.7% and 78.9%, which are both the IRR of this investment.
At this point, you may wonder which IRR is “correct”. Technically, both IRR are correct in the case that the rate is the discount rate that equates your initial investment with your future discounted cash flows, but this again highlights a foundational principle of NPV/IRR analysis:
Use NPV as a decision rule, as IRR could be deceptive.
Bottomline
IRR is a great tool to understand your investment, and Excel provides great built-in functions and add-ins to help your analysis. These tools comes with limitation and don’t forget to enable your “economic sense” to understand the numbers too.
Are you interested in studying more Finance-related Excel skills? These are the must-learn finance lessons.
Binomial Option Pricing (Excel formula)
Binomial Option Pricing (Excel VBA)
Black-Scholes Option Pricing (Excel formula)
Do you find this article helpful? Subscribe to our newsletter to get exclusive Excel tips!